Lecture 11 - Tuning (conclusion)
# MORE TUNING
# Hardware and OS tuning
# Threads
Giving higher/lower priority to some transactions can backfire
- may cause priority inversion
- example
- T1 (higher priority) waiting for lock from T3 (lower priority)
- T2 keeps running while T3 (and therefore T1) keep waiting
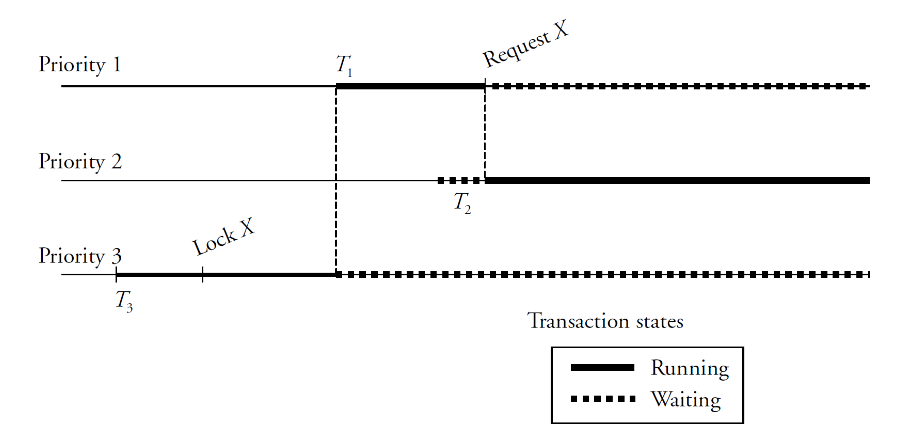
“Best practice” all threads ahev the same priority
Some systems use priority inheritance
- When T1 requests lock on X, the priority of T3 is increased to that of T1
- If priority inheritance is unavailable, give same priority to all threads
In SQL Server, there was priority boosting
- Giving more priority to the database system than to the OS
- Did not work out as expected, has been discontinued
# Database Buffer
- Ideally, store as much as possible in RAM to avoid disk accesses
- Goal of memory tuning
- Frequently read pages should rarely require disk accesses
- Logical vs. physical reads
- Logical reads: pages that need to be accessed
- Physical reads: pages that need to be retrieved from disk
- Logical vs. physical writes
- Logical writes: changes to pages in the buffer (dirty pages)
- Physical writes: dirty pages are written to disk
- Page replacements
- Dirty pages are written to disk to free buffer space
- New pages are read from disk into the free buffer space
Goal is Logical Reads without physical action
Assuming OS paging and page replacements are low
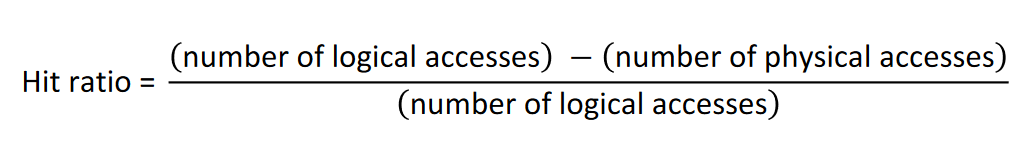
- Aim for hit ratio > 90%
- Run typical workload and check hit ratio
- Increase buffer size until hit ratio flattens out
Experiment with full table scan
- If buffer size is small, table must be read entirely from disk
- LRU replacement strategy keeps evicting pages from memory
- If buffer size is large, the entire table fits in memory
- Query is processed entirely from RAM

Suddenly the WHOLE TABLE can fit in memory. Beyond this point, you dont need more buffer size (for this query)
# Filesystem
Size of disk chunks allocated at one time
- Some file systems call these extents
- In SQL Server, an extent is 8 physically contiguous pages (sequential data. A single seek can read them)
- Allocate large extents to files that need to be scanned often
- Sequential files such as log or history also benefit form large extents
Usage factor of disk pages
- Some pages are full, others are not (bad)
- High usage factor (90% or higher) is good for table scans / reads
- Low usage factor (70% or less) is good for frequent insertions / writes
- In SQL Server, there is also an index fill factor
- percentage of space on each leaf-level page to be filled with data
- Q: What can we do?
- A: Index Maintenance; we often rebuild indexes to reduce their internal fragmentation
Experiment with full table scan
- Cold buffer (empty memory) to read entire table from disk
- Throughput improves by about 10% when usage factor is increased from 70% to 100%

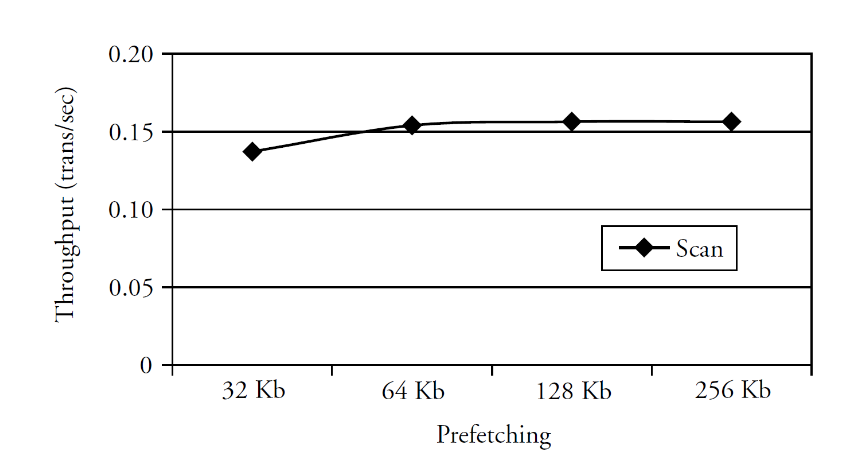
Pre-fetching pages from disk
- Speed up table/index scans by reading ahead more pages from disk
- Experiment with full table scan
- Throughput improves by about 10% when the prefetching size is increased from 32 KB to 128 KB
# RAID Levels
- RAID level 0
- Block striping (round robin block selection), non-redundant (data is lost)
- RAID level 1
- Mirrored disks with block striping*
- RAID level 5
- Block-interleaved distributed parity ( see)
# Database log
- RAID 1 is appropriate for log file(s)
- Mirroring provides fault tolerance with high write throughput
- Writes are synchronous and sequential; no benefit from striping
- We dont want to waste time in checksums (need fast access)
# Temporary Files
- RAID 0 is appropriate for temporary tables or sorting files
- No fault tolerance, high throughput; system can tolerate data loss
- when data doesnt fit in memory we need “temporary runs” (temp files) to store some memory (like in sorts or intermediate values)
# Data and index files
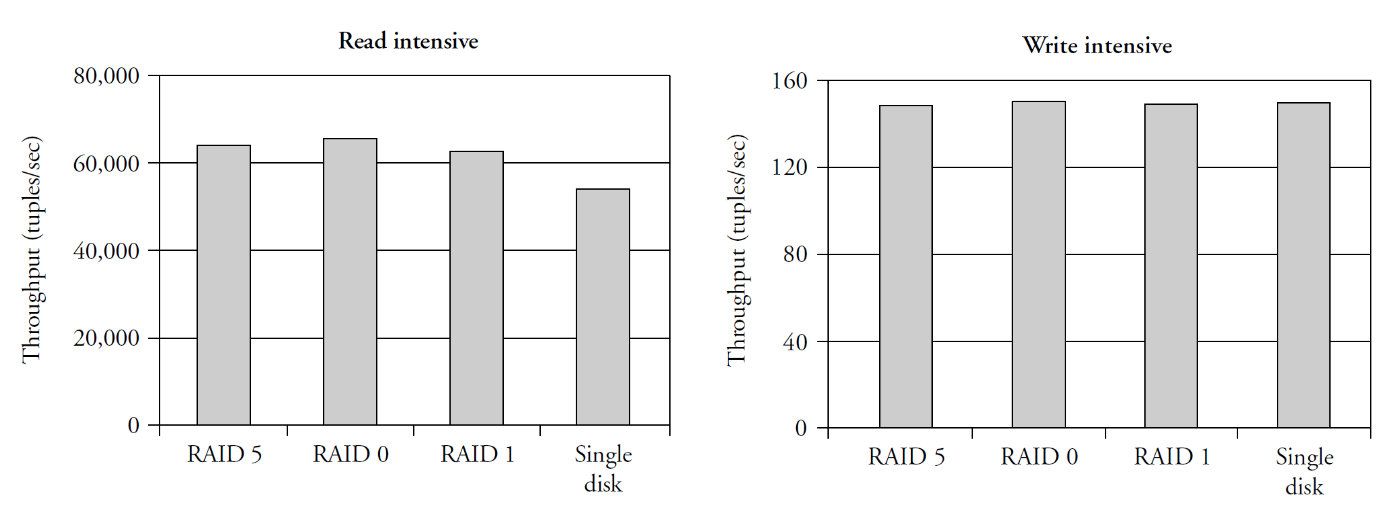
RAID 5 provides fault tolerance and is best suited for read intensive apps
Read performance
- RAID 0, RAID 1, RAID 5 improve read performance with multiple disks
Write performance
- Negative impact of RAID 5 for computing and writing parity block (hidden by controller cache (disks internal cache))
# Controller Cache
Disk controllers have memory that servers as cache
- On read operations, the cache can be used for read-ahead
- On write operations, the cache can be used for write-back
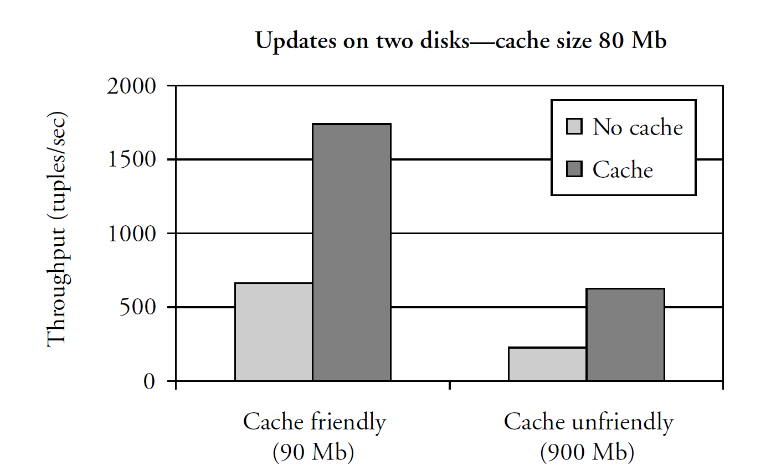
Experiments with write-back mode
- Cache friendly: the data volume is slightly larger than cache
- Cache unfriendly: the data volume is 10x larger than cache
- when cache is full, requests are serialized and waiting time increases
- depends on disk access time and on length of waiting queue The disk will tell us that its written when in disk controller
# Hardware Configuration
Add memory
- Allows increase in buffer size
- Reduces load on disks
- Increases the hit ratio
- Reduces page replacement and OS paging
Add disks
- Put the log on a separate disk to ensure that writes are sequential (most important)
- Use a different RAID level to achieve better write performance
- e.g. switch from RAID 5 to RAID 1 for write-intensive apps
- Partition large tables across several disks
- Write-intensive apps should have non-clustered indexes to separate disk, because each modification updates those indexes
- Read-intensive apps should partition tables across multiple disks to balance the read load (can be achieved just by using RAID)
Add processors
- Off-load non-database tasks to other processors
- Provide computing power for data mining apps on copy of database
- Connect many independent systems together by a high-speed network
- Different options for sharing resources (memory, disks, processors)
Shared-everything, shared-disks, or shared-nothing environment
# Database monitoring / troubleshooting
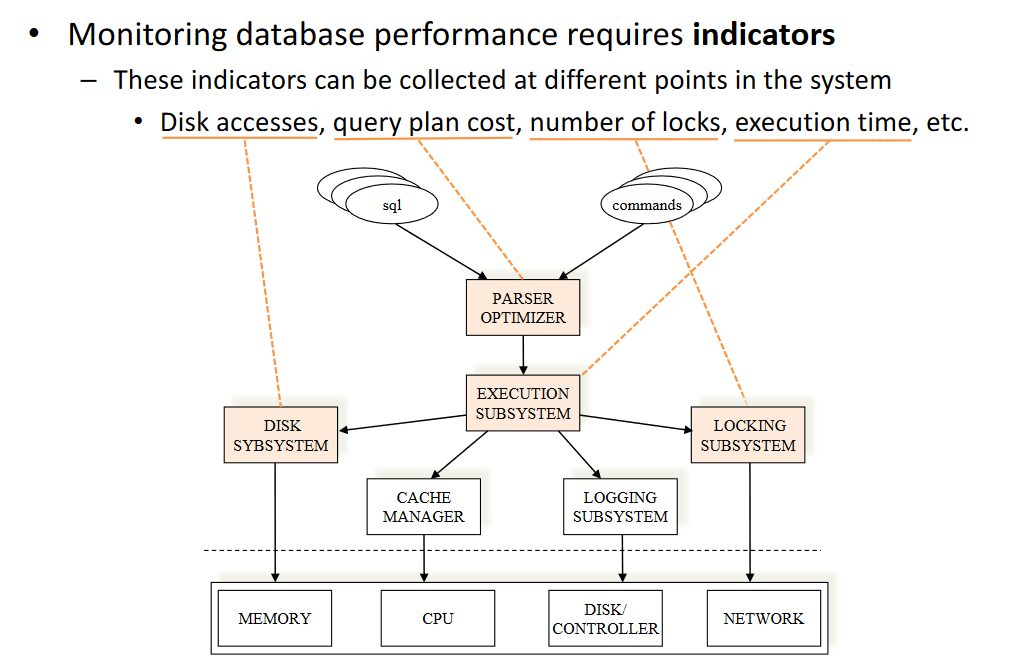
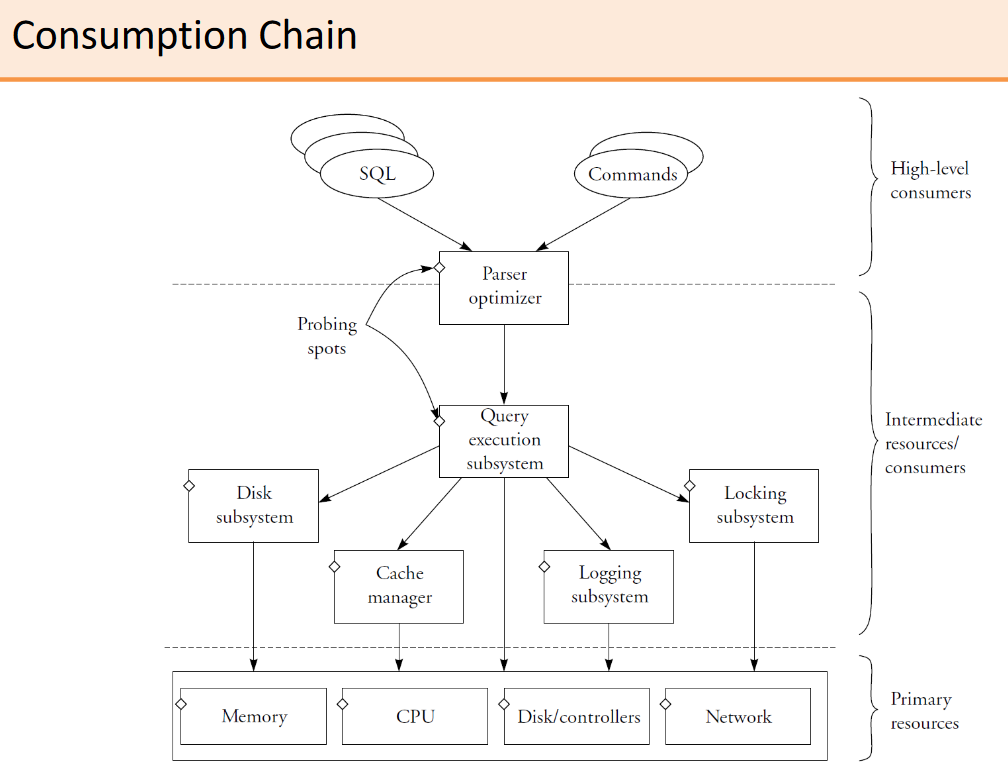
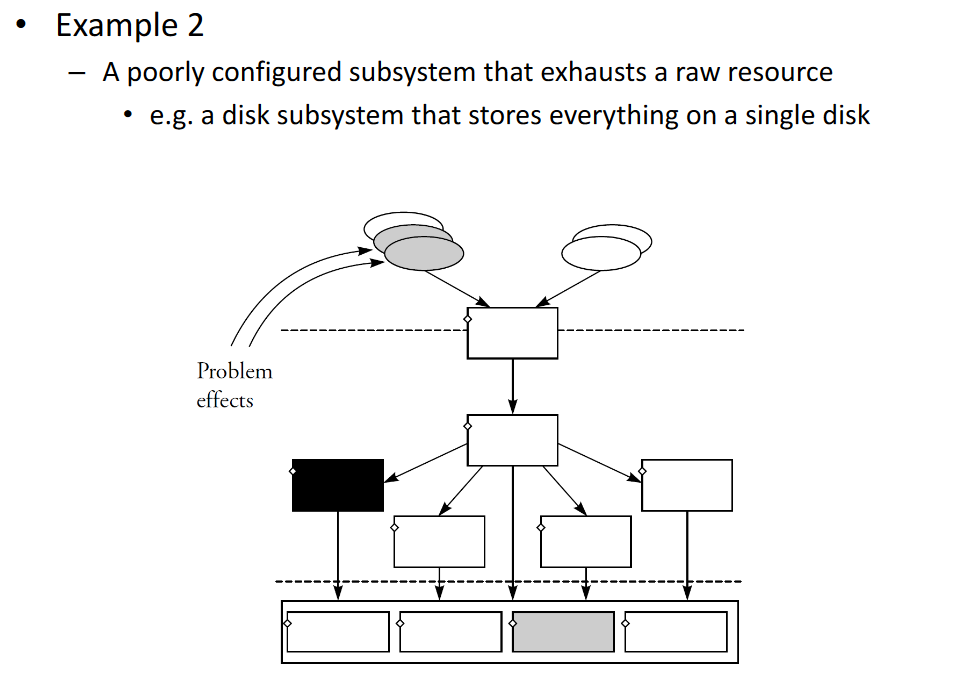
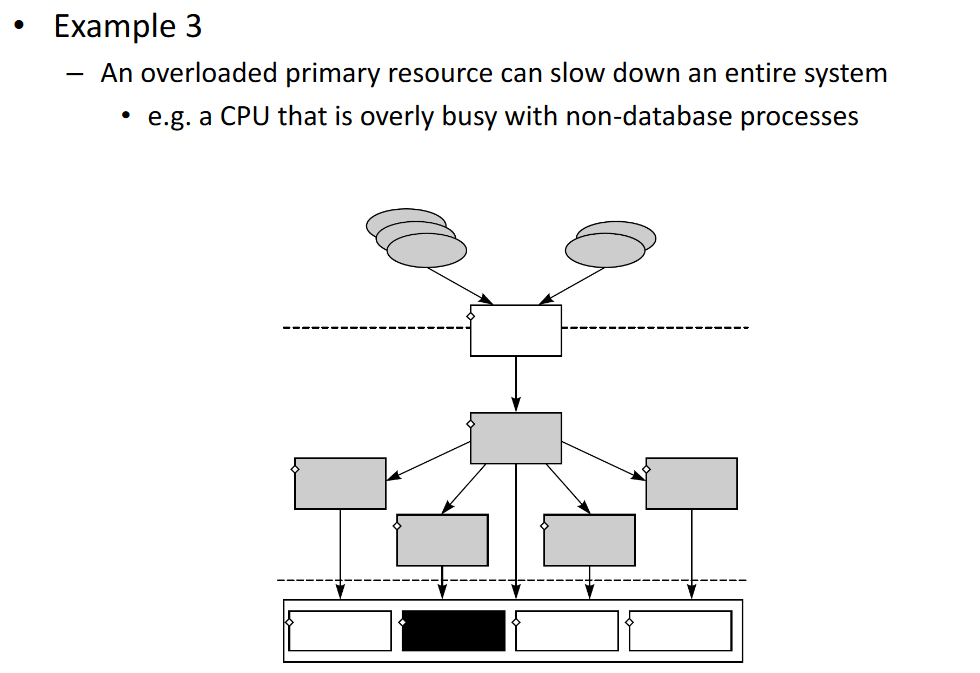
# Producer-consumer hierarchy
- High-level consumers
- Users or applications issuing SQL queries or database commands
- Intermediate consumers/resources
- Database subsystems that interact with each another those requests
- Primary resources
- Raw resources of the machine being managed by the OS
# Performance Problems
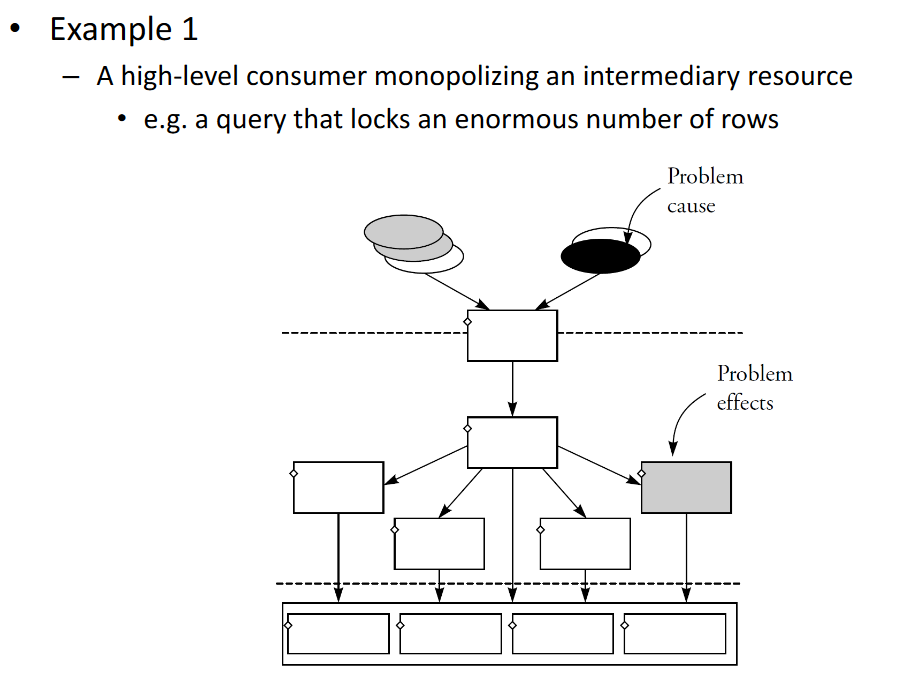
Better eg. for intermediate resources problem. We have a certain DB configuration that exhaustes a certain resource (lock escalation)
Better eg. for Primary resources problem. All our queries result in physical reads
# Systematic Approach: Three Questions
# 1. Are critical queries being served in the most efficient manner?
- High-level consumer question
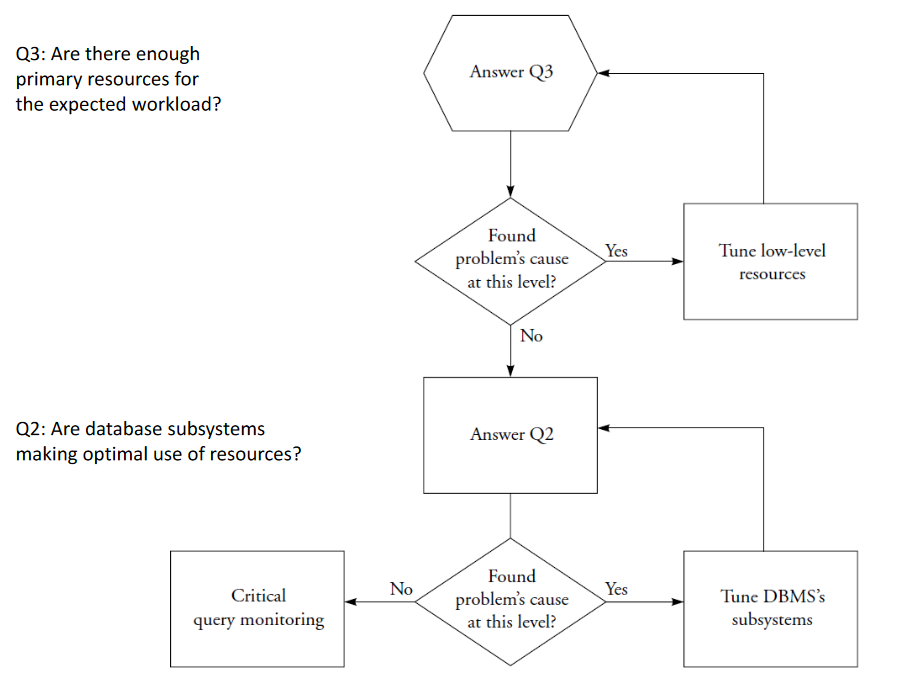
# 2. Are database subsystems making optimal use of resources?
- Intermediate consumer/resource question
# 3. Are there enough primary resources for the expected workload?
- Primary resources question
# Critical Query Monitoring
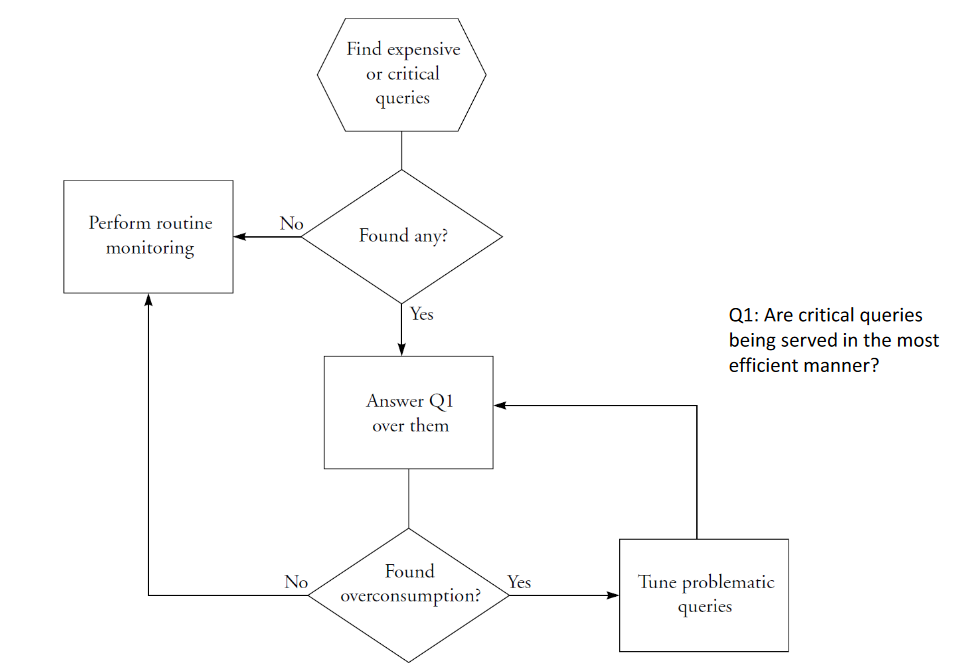
# Routine Monitoring
# Monitoring Tools
- Query Plan Explainers
- Shows the execution plan and estimated costs
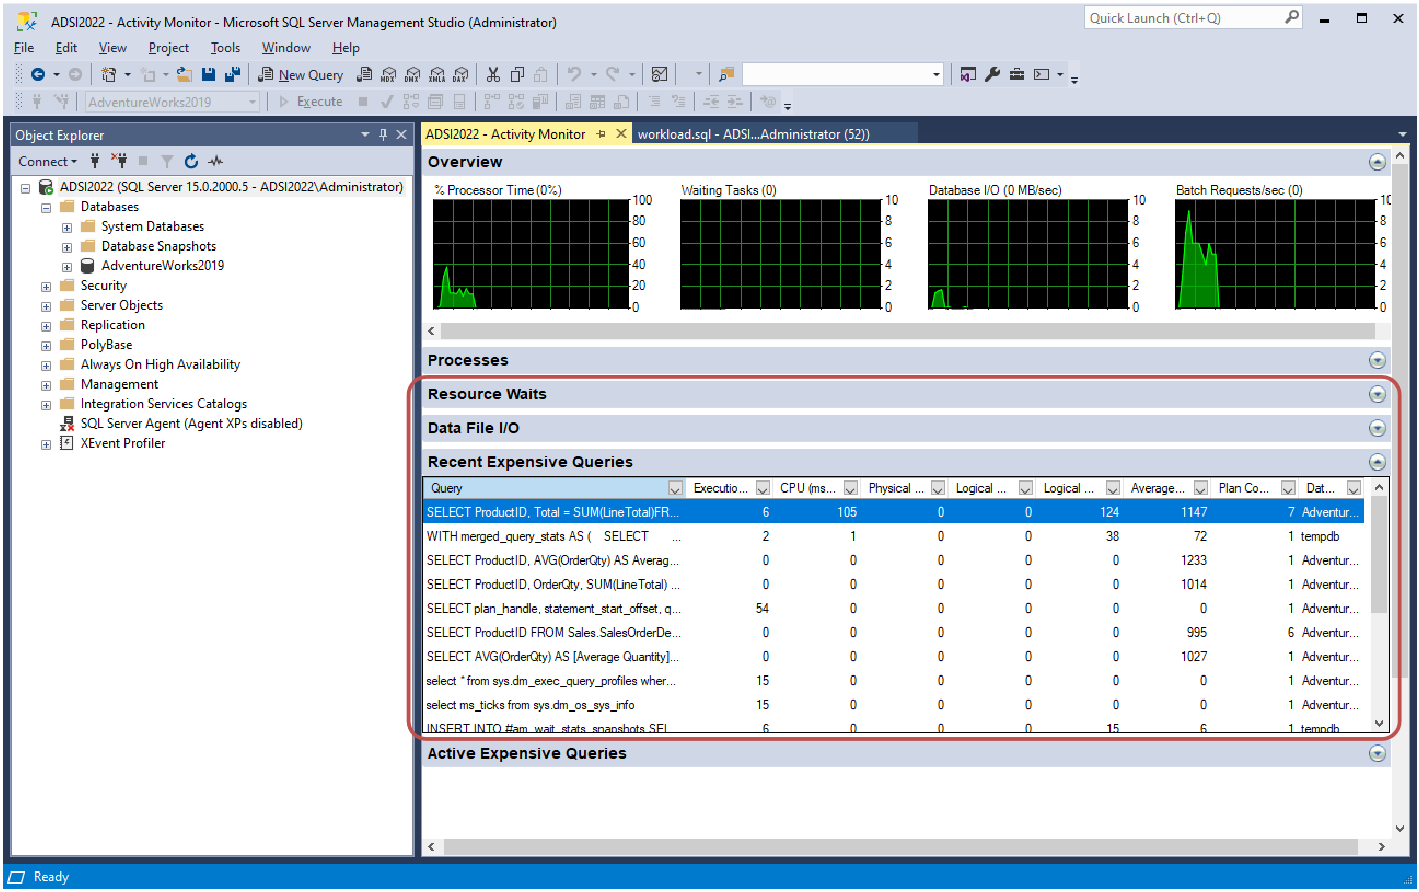
- Performance Monitors
- Tools that access the database internal counters and metrics
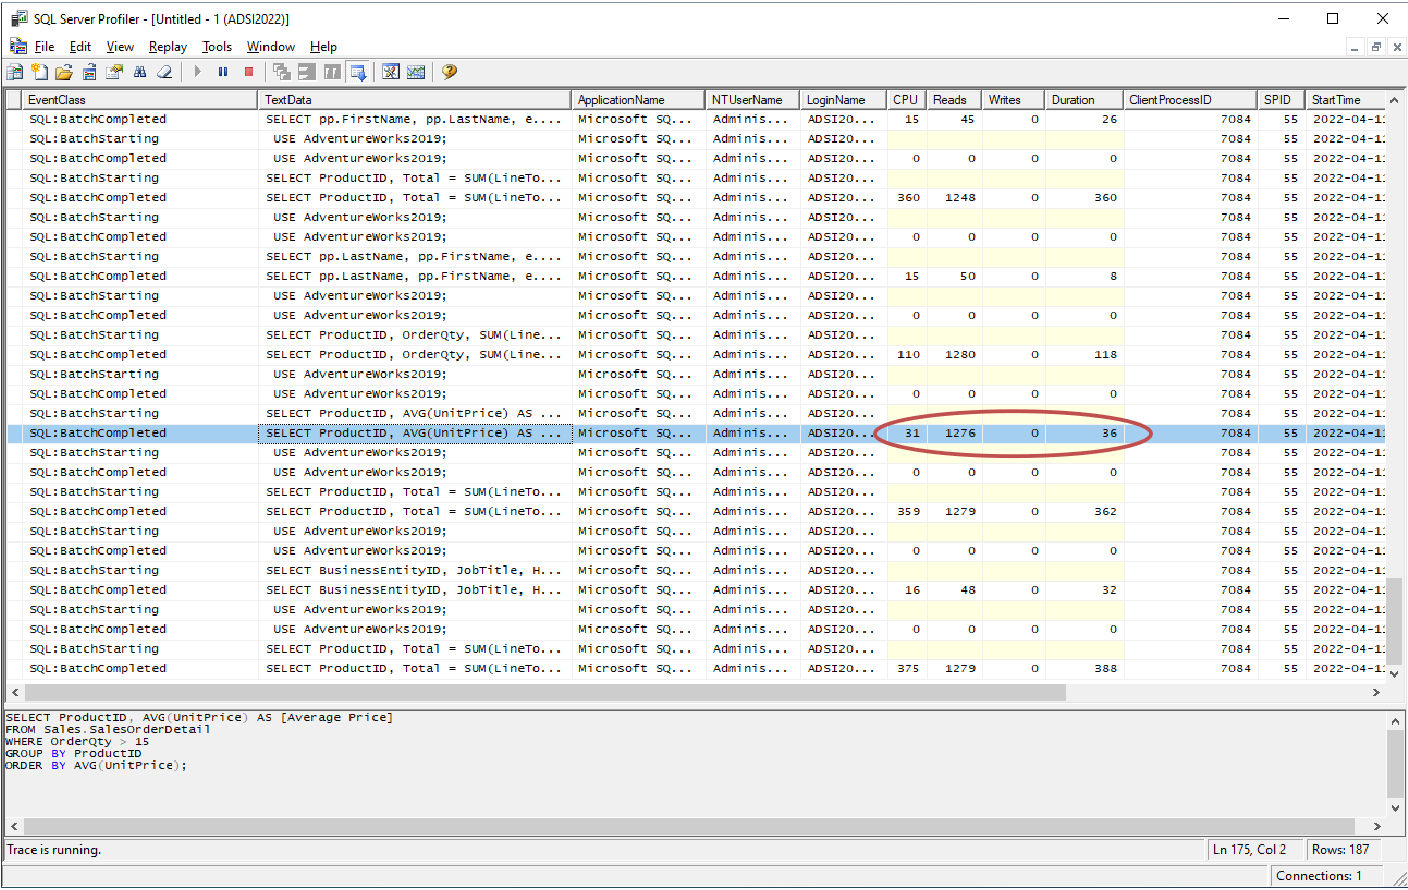
- Event Monitors
- Record performance measures only when an event occurs
# Investigating High-Level Consumers
- Answer question 1
- Are critical queries being served in the most efficient manner?
- Identify the critical queries
- Use Event Monitor to find end-of-statement with execution measures
- Analyze the execution plan
- Use Query Plan Explainer to analyze the relative cost of each operation
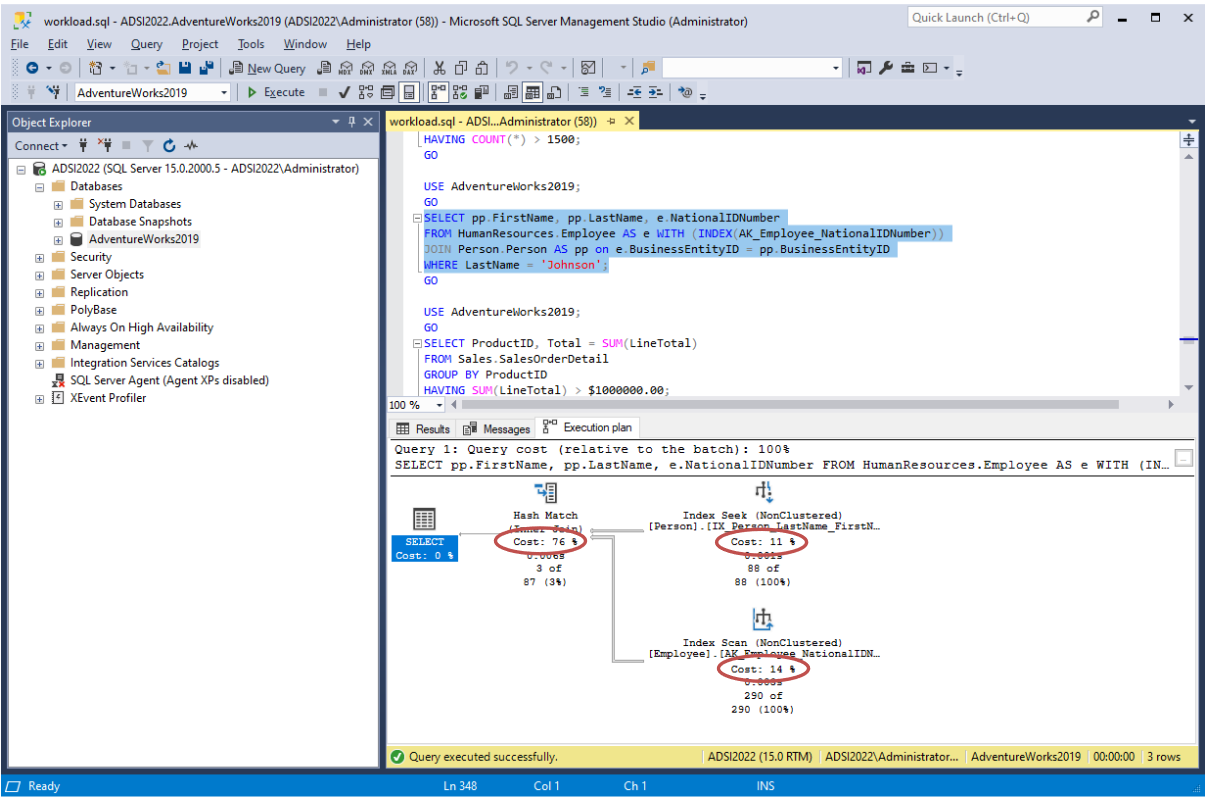
In the execution plan, pay attention to:
- Access methods
- sequential scan, index lookup, etc.
- Sorts
- caused by ORDER BY, GROUP BY or DISTINCT
- Intermediate results
- materialization to temporaries
- Order of operations
- joins, sorts, aggregations, filtering
- Algorithms used in operations
- types of join, etc.
- Profile the execution
- Use Performance Monitor to analyze duration and resource consumption
Duration involves 3 indicators:
- Elapsed time
- The time it took to process the query as perceived by a user
- CPU time
- The time that was actually used by the CPU to process the query
- Wait time
- The time the query was waiting for a resources to become available
Two common scenarios
- Elapsed time close to CPU time
- Probably difficult to optimize any further
- Discrepancy between elapsed time and CPU time
- Points to a problem in resource consumption
- Possibly a contention problem or a poorly performing resource
- Run the query in isolation to investigate the cause
# Investigating Intermediate Resources/Consumers
- Answer question 2
- Are database subsystems making optimal use of resources?
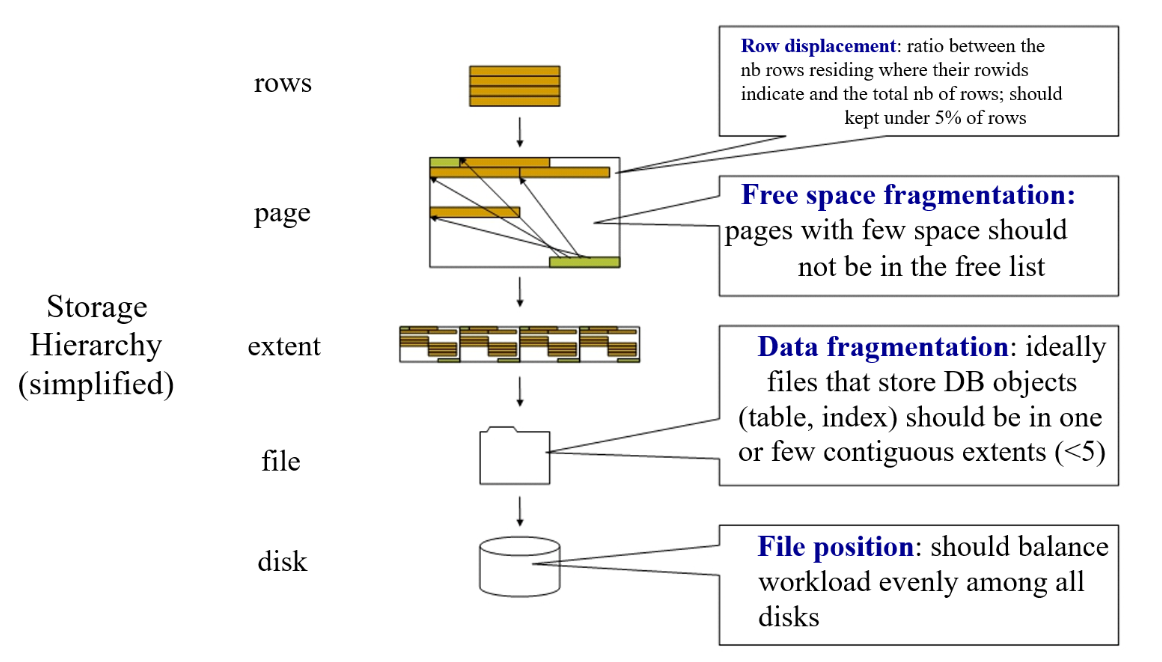
- Disk subsystem
- A table should be stored contiguously in a physical disk
- Avoid free space between records (data fragmentation)
- Table records should be stored in their correct order
- Avoid records out of place (row displacement)
- Periodic file reorganization may be necessary
- A table should be stored contiguously in a physical disk
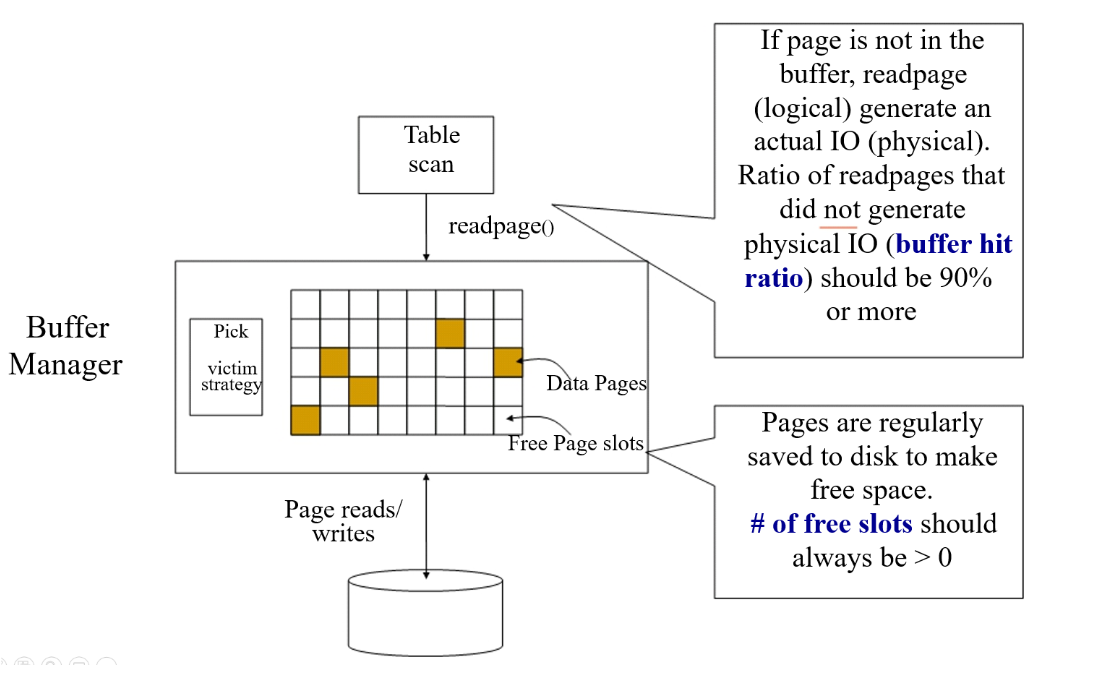
- Buffer manager
- Two main performance indicators to monitor
- Hit ratio – percentage of times that requested page is already in buffer
- Number of free pages – how much space is left in the buffer
- In SQL Server, these and other metrics can be obtained from system views
- Two main performance indicators to monitor
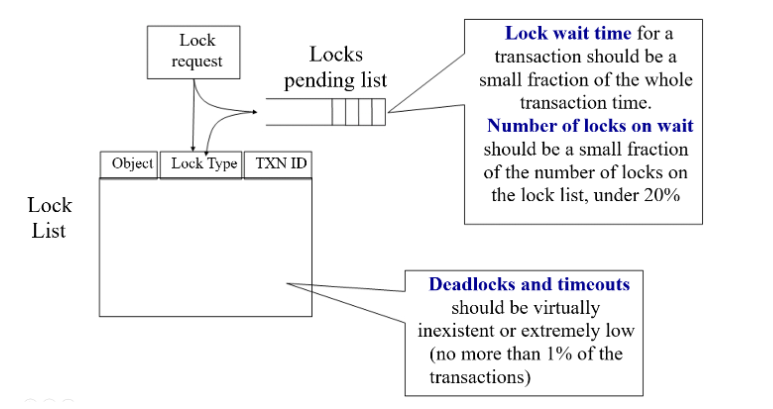
- Locking subsystem
- Useful indicators
- Average lock wait time
- Number of locks on wait
- Number of deadlocks or timeouts
- SQL Server provides comprehensive wait statistics through system views
- Useful indicators
- Logging subsystem
- Useful indicators
- Number of log waits – ensure log can keep up with transactions
- Log expansions or log archives – due to lack of space
- Log cache hit ratio – analogous to buffer cache hit ratio
- Log waits > 0 means transactions are being held due to log writes
- Useful indicators
# Investigating Primary Resources
- Answer question 3
- Are there enough primary resources for the expected workload?
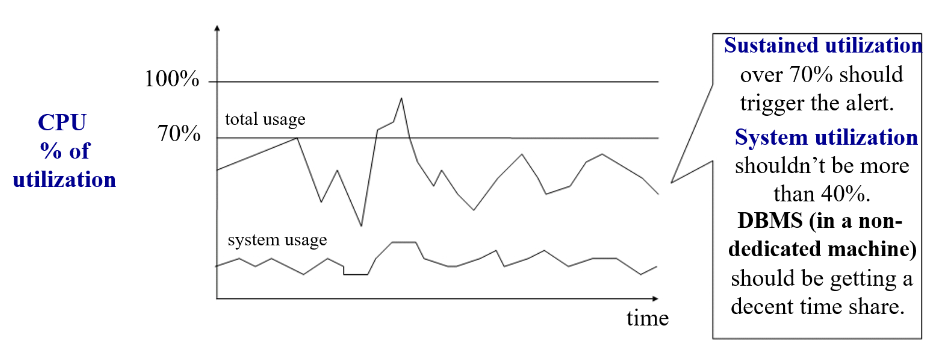
- CPU
- Main indicator
- Percentage of utilization
- Use OS task manager to monitor CPU utilization
- Identify whether processes are database or non-database related
- Check CPU utilization of system (OS) processes in idle state
- Main indicator
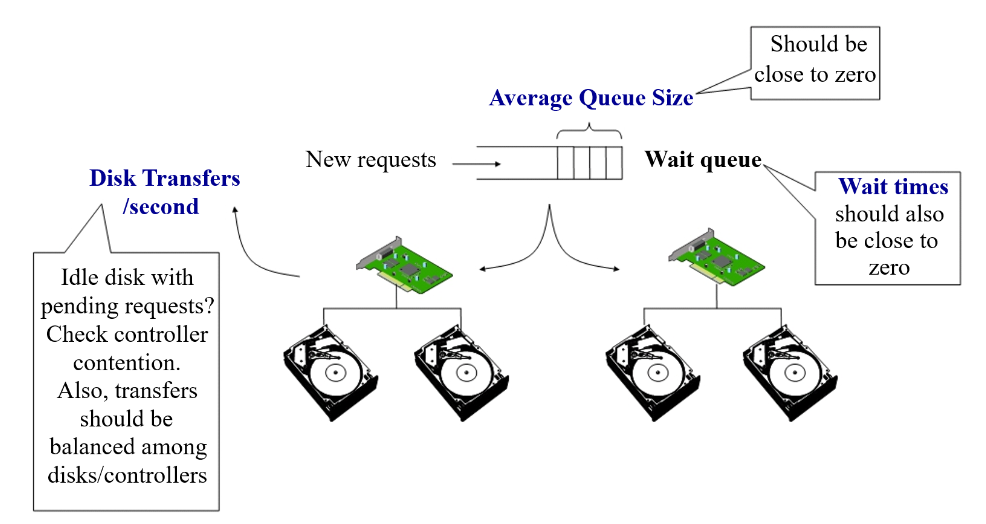
- Disks
- Main indicators
- Average size of the waiting queue
- Average time taken to service a request
- Bytes transferred per second
- Disk utilization can be monitored with OS utilities
- Main indicators
- Memory
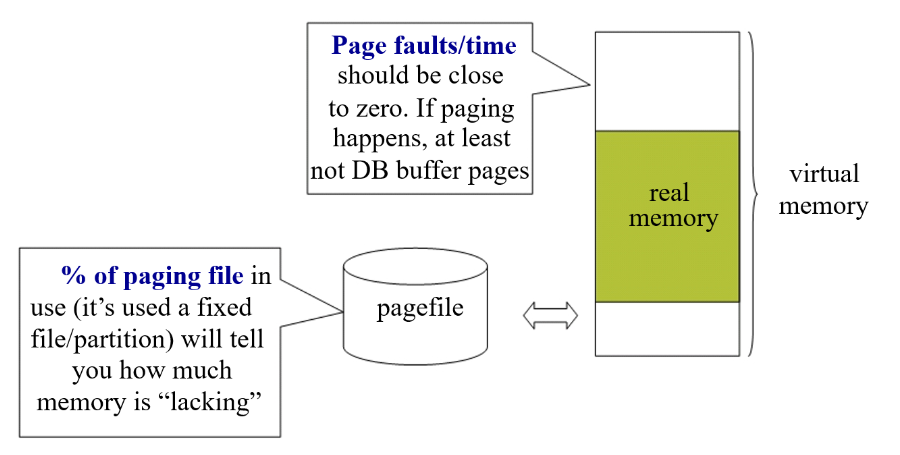
- Some indicators
- Number of page faults/time
- Percentage of paging file in use
- Size of paging/swap file is an indication of how much memory is lacking
- Some indicators